Which of the following scenarios would explain the change in equilibrium shown in the accompanying figure? 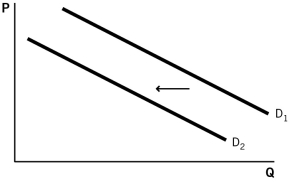
A) an increase in an input price
B) a decrease in the number of buyers in a market
C) an increase in the price of a substitute good
D) an increase in the expected future price
E) a negative technological change
Correct Answer:
Verified
Q78: When the demand curve shifts to the
Q79: The equilibrium price of peanut butter is
Q84: During the winter months,many elderly persons leave
Q86: The economists at JET Consulting consider Campbell's
Q86: In the first few months of 2012,the
Q88: According to the supply and demand model,when
Q99: When both curves shift:
A) equilibrium price is
Q103: The difference between a tax and a
Q113: A decrease in demand is represented by
Q139: If the price and quantity for a
Unlock this Answer For Free Now!
View this answer and more for free by performing one of the following actions

Scan the QR code to install the App and get 2 free unlocks

Unlock quizzes for free by uploading documents