The change in equilibrium shown in the accompanying figure would be explained by a(n) : 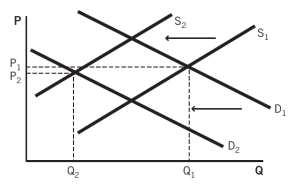
A) increase in the price of an input and an increase in the price of a complement.
B) decrease in the price of an input and an increase in the price of a complement.
C) decrease in the price of an input and an increase the in price of a substitute.
D) increase in the price of an input and a decrease in the price of a complement.
E) increase in the price of an input and a increase in the price of a substitute.
Correct Answer:
Verified
Q106: When supply shifts left and demand shifts
Q110: What happens to the equilibrium price and
Q115: When both supply and demand decrease,the equilibrium
Q131: When people move to an area of
Q135: In one year,15 bowling alleys opened in
Q140: Many consumer items eventually go out of
Q144: Shoes are considered to be a normal
Q152: In agriculture,a "bumper crop" refers to a
Q154: Top Ramen is a brand of noodles
Q159: Without using a graph,explain the difference between
Unlock this Answer For Free Now!
View this answer and more for free by performing one of the following actions

Scan the QR code to install the App and get 2 free unlocks

Unlock quizzes for free by uploading documents