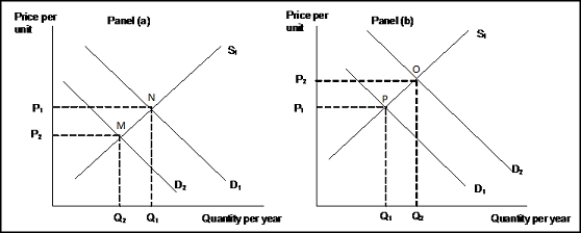
-(Exhibit: Shifts in Demand and Supply) Which diagram best illustrates what would happen in the handheld calculator industry if elementary schools encouraged their use?
A) the movement from M to N in panel (a)
B) the movement from P to O in panel (b)
C) the movement from O to P in panel (b)
D) the movement from M to N in panel (a) .
Correct Answer:
Verified
Q32: Plastic and steel are substitutes in the
Q169: A decrease in supply with no change
Q175: An increase in demand with no change
Q183: A decrease in demand and a decrease
Q184: Use the following to answer questions .
Exhibit:
Q187: Use the following to answer question(s): Shifts
Q193: Use the following to answer question(s): Demand
Q194: Given that milk and cookies are complements,
Q195: The fact that food consumption in the
Q197: Use the following to answer questions .
Exhibit:
Unlock this Answer For Free Now!
View this answer and more for free by performing one of the following actions

Scan the QR code to install the App and get 2 free unlocks

Unlock quizzes for free by uploading documents