The table below shows the percentage difference between real and potential GDP and the rate of inflation for the years 1999 through 2003. If there were a presidential election in the year 2000, would these data support the view that there was a political business cycle during this period? 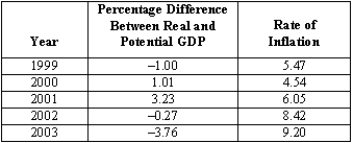
Correct Answer:
Verified
View Answer
Unlock this answer now
Get Access to more Verified Answers free of charge
Q162: Suppose a country is experiencing a deflation
Q163: Answer the questions below:
(A)Explain how each of
Q164: Is the interest rate on the federal
Q167: Suppose the economy is in a boom
Q168: The table shows the percentage difference between
Q170: Describe in detail how the Fed takes
Q170: Answer the questions below:
(A)What are the advantages
Q171: Suppose Congress had the power to set
Q175: Explain why independent central banks need to
Q178: Explain how the facts justify the conclusion
Unlock this Answer For Free Now!
View this answer and more for free by performing one of the following actions

Scan the QR code to install the App and get 2 free unlocks

Unlock quizzes for free by uploading documents