Exhibit 25-2 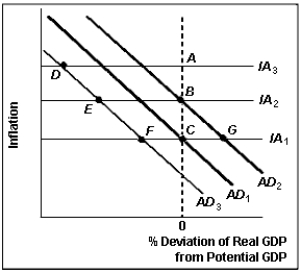
-According to Exhibit 25-2, which point best represents where the U.S. economy was in mid-2007?
A) F
B) C
C) E
D) G
E) B
Correct Answer:
Verified
Q138: A supply shock is exactly the opposite
Q139: Suppose there is a sharp decline in
Q140: A price shock causes movement along the
Q141: Exhibit 25-2 Q142: In 2008, stock markets in the United Q144: The best explanation for the recent economic Q145: What is meant by the term stagflation? Q146: If the price of salt quadruples, will Q147: The leftward shift of the aggregate demand Q148: Suppose, for some hypothetical economy, an electric![]()
Unlock this Answer For Free Now!
View this answer and more for free by performing one of the following actions

Scan the QR code to install the App and get 2 free unlocks

Unlock quizzes for free by uploading documents