Exhibit 25-3 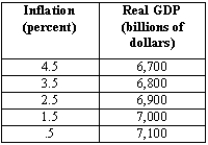
-PART I Use the data from Exhibit 25-3 to graph the aggregate demand curve:
(A)Suppose the current inflation rate is 3.5 percent and potential GDP is $6,900 billion.Draw the inflation adjustment line.What is the current deviation of real GDP from potential?
(B)In the long run,what will the inflation rate be if there is no change in economic policy? Explain how this adjustment will take place.
PART II
Suppose that after the long-run adjustment back to potential,the Fed changes its policy rule so the inflation target is 3.5 percent and potential GDP remains at $6,900 billion.Use the data to show the shift in the aggregate demand/inflation curve.
(A)What type of monetary policy is the Fed undertaking?
(B)How does the Fed accomplish this goal? What is the response of investment and net exports?
(C)In the short run,what is the deviation from potential GDP?
(D)How will the inflation adjustment line adjust in the medium and long run? Explain how this occurs.
Correct Answer:
Verified
(A)The gap between real and potential G...
View Answer
Unlock this answer now
Get Access to more Verified Answers free of charge
Q155: The leftward shift of the AD curve
Q162: Suppose the central bank lowers its target
Q163: Draw an aggregate demand inflation adjustment diagram
Q164: Suppose exports increase.According to the shares of
Q165: Economic fluctuations in the United States during
Q165: Suppose the income tax rate increases. What
Q170: Suppose the target rate of inflation is
Q170: Explain how two shifts in the aggregate
Q171: A single factor caused the 2008-09 recession.
Q176: Interest rates typically rise prior to a
Unlock this Answer For Free Now!
View this answer and more for free by performing one of the following actions

Scan the QR code to install the App and get 2 free unlocks

Unlock quizzes for free by uploading documents