Exhibit 24-1 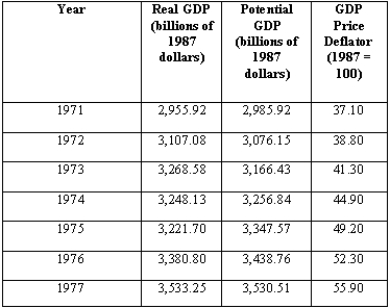
-According to the data in Exhibit 24-1,the percentage deviation of real GDP from potential GDP in 1976 was
A) 1.7 percent.
B) -5.8 percent.
C) 2.7 percent.
D) -4.9 percent.
E) -1.7 percent.
Correct Answer:
Verified
Q1: The economic fluctuations model is used
A)for all
Q2: The best way to approach the debate
Q10: When interest rates increase,
A)government purchases will increase
Q14: The aggregate demand curve shows the relationship
Q15: John Maynard Keynes developed the economic fluctuations
Q16: Unlike the demand for bananas in a
Q18: The aggregate demand curve shows the relation
Q32: A higher value of the domestic currency
A)means
Q35: If the nominal interest rate exceeds the
Q38: Which of the following is the best
Unlock this Answer For Free Now!
View this answer and more for free by performing one of the following actions

Scan the QR code to install the App and get 2 free unlocks

Unlock quizzes for free by uploading documents