Suppose the productivity function is given by
 .
.
(A)Draw a graph that shows the relationship between productivity and capital per hour of work. What assumption are you making about the returns to capital? Please explain.
(B)Pick an initial point on your productivity function and label the points  and
and 
(C) Fill in the four blanks in the following table.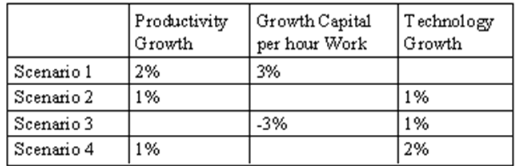
D) For growth scenario 1, label the new levels of productivity and capital per hour of work on your graph. Explain briefly.
(E)For growth scenario 3, label the new levels of productivity and capital per hour of work on your graph. Please draw a separate graph for this part. Explain briefly.
(F)For each of the four scenarios, identify whether labor and capital are growing at the same rate, whether labor is growing faster than capital, or whether capital is growing faster than labor.
Correct Answer:
Verified
View Answer
Unlock this answer now
Get Access to more Verified Answers free of charge
Q101: The coefficient on capital growth is really
Q101: If the growth rate of technology is
Q107: The growth accounting formula is useful for
Q110: Suppose that in a given year there
Q111: The slowdown in U.S.economic growth that took
Q112: If output per hour grows by 4
Q112: If capital per hour of work is
Q114: The growth accounting formula explains the growth
Q117: Explain why the contribution of capital per
Q119: The growth rate of productivity is measured
Unlock this Answer For Free Now!
View this answer and more for free by performing one of the following actions

Scan the QR code to install the App and get 2 free unlocks

Unlock quizzes for free by uploading documents