Exhibit 21-1 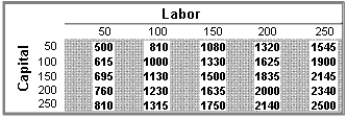
-Answer the questions below:
(A)Refer to Exhibit 21-1. The table shows how output (shaded) depends on capital and labor. Using the table, draw the production function Y = F(L), when the capital stock (K) is 50 and when it is 100. What do you observe? Now draw the same curve when the capital stock is 150 and 200. Do you observe any difference in the resulting increase in output?
(B)Are there diminishing returns to labor and capital? Explain.
Correct Answer:
Verified
View Answer
Unlock this answer now
Get Access to more Verified Answers free of charge
Q123: Most of the R&D funds in the
Q125: Some economists believe that productivity growth is
Q128: Disembodied technological change pertains to technological development
Q129: Which of the following has not been
Q131: Suppose two separate growth-accounting studies between 1980
Q133: Which of the following is the best
Q140: During the period 1996-2006,capital growth contributed twice
Q140: Which of the following is the best
Q142: Exhibit 21-1 Q158: Suppose you are given the following information
![]()
Unlock this Answer For Free Now!
View this answer and more for free by performing one of the following actions

Scan the QR code to install the App and get 2 free unlocks

Unlock quizzes for free by uploading documents