Multiple Choice
Exhibit 18-5 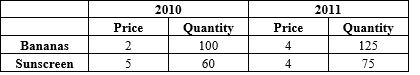
-If prices were kept constant at 2011 levels, then according to the data in Exhibit 18-5, production between 2010 and 2011 changed by
A) 25 percent.
B) 60 percent.
C) 28 percent.
D) 20 percent.
E) 30 percent.
Correct Answer:
Verified
Related Questions
Q121: Which of the following statements is true?
A)The
Q128: If nominal GDP is $5 trillion, and
Q135: In the base year, nominal and real
Q136: Exhibit 18-6 Q138: The CPI is a measure of Q140: How often during the year does the Q141: Which of the following best describes what![]()
A)the price
Unlock this Answer For Free Now!
View this answer and more for free by performing one of the following actions

Scan the QR code to install the App and get 2 free unlocks

Unlock quizzes for free by uploading documents