The following table shows real GDP from 1991 through 1999 for a hypothetical economy. On a graph that measures real GDP on the vertical axis and time on the horizontal axis, plot real GDP using the data in the table. Draw in potential GDP and show the peak, recession, trough, and recovery phases of this business cycle. 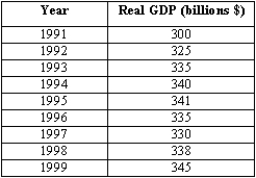
Correct Answer:
Verified
View Answer
Unlock this answer now
Get Access to more Verified Answers free of charge
Q134: How do fiscal policy and monetary policy
Q137: What explains the uneven effect a recession
Q140: How might the economic fluctuations theory explain
Q141: Suppose you read in the newspaper that
Q144: Suppose you have savings deposited in an
Q147: Is it a good idea for the
Q149: Exhibit 17-5 Q153: Answer the questions below: Q153: Exhibit 17-5 Q155: Suppose you have $1,000, which you can![]()
(A)According to the economic![]()
Unlock this Answer For Free Now!
View this answer and more for free by performing one of the following actions

Scan the QR code to install the App and get 2 free unlocks

Unlock quizzes for free by uploading documents