The table shows the price of motor fuel (mainly gasoline) and the overall price level (the consumer price index) in five-year intervals over the period 1970 through 1990. 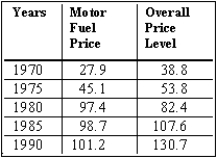 (A)Plot a diagram of the relative price of motor fuel for the 1970-1990 period.
(B)Explain what has been happening to the relative price of motor fuel over this period.
Correct Answer:
Verified
View Answer
Unlock this answer now
Get Access to more Verified Answers free of charge
Q3: The relative price of an iPad is
A)the
Q5: All of the following are what economists
Q5: If two variables are correlated, then it
Q8: To determine causality in many sciences,researchers
A)check for
Q11: If the price of gasoline decreases but
Q12: Causation
A)occurs when there is no correlation.
B)occurs when
Q13: Experimental economics
A)is the dominant method in economics.
B)does
Q17: Which of the following is not an
Q19: To see whether the price of gasoline
Q19: All of the following are examples of
Unlock this Answer For Free Now!
View this answer and more for free by performing one of the following actions

Scan the QR code to install the App and get 2 free unlocks

Unlock quizzes for free by uploading documents