Exhibit 2-1 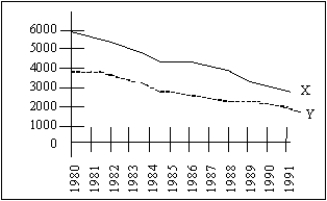
-Exhibit 2-1 shows movements of two variables,X and Y,from 1980 through 1991.From this diagram the most one can conclude is that
A) X and Y are positively correlated with each other.
B) X and Y are negatively correlated with each other.
C) X and Y are positively correlated with each other and either X causes Y or Y causes X.
D) we cannot say anything about how X and Y are related because we do not know the units of measurement for X and Y.
E) X and Y are not correlated with each other.
Correct Answer:
Verified
Q21: Explain why it is more difficult to
Q23: A microeconomic model must be much smaller
Q24: An economic model is a tool used
Q27: Which of the following is more of
Q28: Economic models
A)are different from the phenomena they
Q30: Which of the following is considered a
Q30: Economic models differ from those in the
Q33: Macroeconomics deals with large industries such as
Q34: Macroeconomics is concerned primarily with
A)the economy as
Q36: Economic models need to resemble, as much
Unlock this Answer For Free Now!
View this answer and more for free by performing one of the following actions

Scan the QR code to install the App and get 2 free unlocks

Unlock quizzes for free by uploading documents