Exhibit 2-2 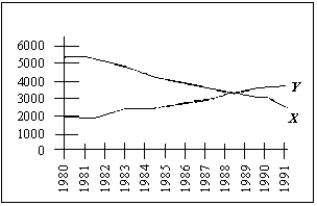
-Exhibit 2-2 shows the relationship between X and Y between 1980 and 1991.Suppose this correlation between X and Y continues to hold for the next 10 years.If Y declines over the period 1993 through 1998,we would expect
A) X to fall over the same period because X and Y are negatively correlated.
B) X to increase over the same period because X and Y are positively correlated.
C) X to increase over the same period because X and Y are negatively correlated.
D) the correlation to be unknown because we do not know the units of measurement for X and Y and thus cannot say anything about how X and Y are related.
E) X to fall over the same period because X and Y are positively correlated.
Correct Answer:
Verified
Q21: Explain why it is more difficult to
Q24: An economic model is a tool used
Q28: Economic models
A)are different from the phenomena they
Q29: If the quantity demanded of coffee increases
Q30: Economic models differ from those in the
Q30: Which of the following is considered a
Q31: What is the difference between correlation and
Q37: When economists explain the relationship between the
Q39: Two variables are negatively correlated if
A)the value
Q40: Economic models
A)are not complicated because the behavior
Unlock this Answer For Free Now!
View this answer and more for free by performing one of the following actions

Scan the QR code to install the App and get 2 free unlocks

Unlock quizzes for free by uploading documents