Figure 16-3
Panel (a) Panel (b) 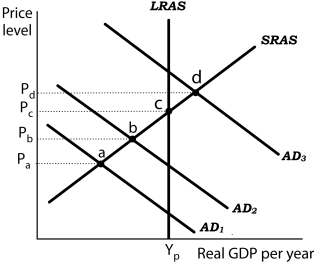
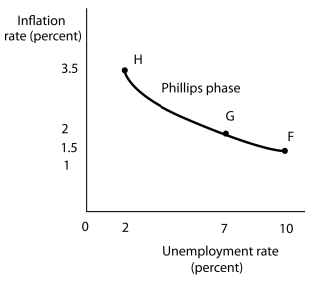 Suppose the level of potential output (YP) is $1,000 billion and the natural rate of unemployment is 5%. In Panel (a) , the aggregate demand curve in Period 1 is AD1. Assume that the price level in Period 1 has risen by 1.5% from the previous period and the unemployment rate is 10%. Thus, in Panel (b) point F shows an initial rate of inflation of 1.5% and an unemployment rate of 10%. Similarly, point b in Panel (a) corresponds to point G in Panel (b) and point d in Panel (a) corresponds to point H in Panel (b) .
-Refer to Figure 16-3. If the economy were experiencing a recessionary gap, it would be
Operating at
A) point a only.
B) point b only.
C) either point a or point b.
D) point d only.
Correct Answer:
Verified
Q41: The Phillips phase of the inflation-unemployment relationship
Q42: Figure 16-6 Q45: Figure 16-7 Q46: The essential feature of a stagflation phase Q47: Figure 16-7 Q50: Figure 16-3 Q51: Figure 16-4 Q52: In a stagflation phase, a decrease in Q54: The Phillips phase of the inflation-unemployment relationship Q60: Figure 16-7 Unlock this Answer For Free Now! View this answer and more for free by performing one of the following actions Scan the QR code to install the App and get 2 free unlocks Unlock quizzes for free by uploading documents![]()
![]()
![]()
Panel (a) Panel (b) 
![]()
![]()

