Multiple Choice
Figure 16-7 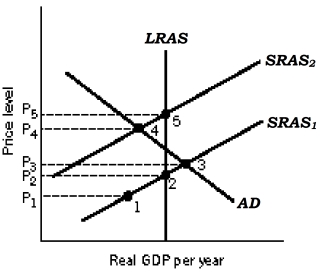
-Refer to Figure 16-7. Over time, the aggregate supply curve shifts from SRAS1 to SRAS2
Because of
A) rising output prices.
B) economic agents adjust their expectations regarding prices and wages downwards.
C) a fall in nominal wages.
D) economic agents adjust their expectations regarding prices and wages upwards.
Correct Answer:
Verified
Related Questions
Q43: The Phillips phase of the inflation-unemployment relationship
Q47: In the short run, if the economy
Q49: The critical feature of the
A) Phillips phase


