Figure 8-2 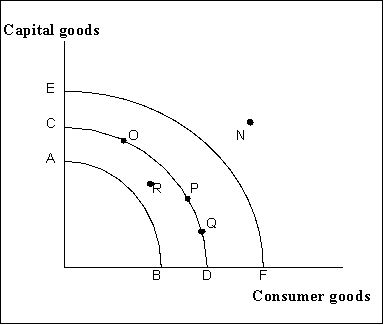
-Refer to Figure 8-2. A cyclical increase in the level of economic activity is represented by a
A) shift from curve CD to curve AB.
B) shift from curve CD to curve EF.
C) movement from point Q to point O on the frontier CD.
D) movement from point R inside the frontier CD to point P on the frontier CD.
Correct Answer:
Verified
Q1: Which of the following statements is true?
A)
Q7: Which of the following applies to economic
Q9: Figure 8-2 Q9: Economic growth is defined as Q10: Using actual values of real GDP to Q11: Economic growth is an exponential process. What Q12: Economic growth is best measured by the Q13: The rule of 72 states that grows Q18: What is the relationship between average household Q19: Economists do not use actual values of![]()
A) growth in
Unlock this Answer For Free Now!
View this answer and more for free by performing one of the following actions

Scan the QR code to install the App and get 2 free unlocks

Unlock quizzes for free by uploading documents