Refer to the information provided in Figure 28.8 below to answer the question(s) that follow. 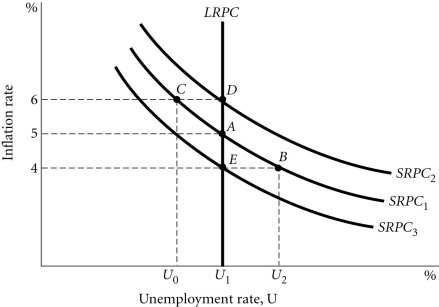 Figure 28.8
-Refer to Figure 28.8. Along SRPC1, expected inflation equals
A) 6%.
B) 5%.
C) 4%.
D) cannot be determined from the figure.
Correct Answer:
Verified
Q241: In the long run, the Phillips curve
Q246: If aggregate supply changes when aggregate demand
Q251: At the natural rate of unemployment, frictional
Q253: If aggregate demand changes when aggregate supply
Q257: The unemployment rate and the level of
Q264: If the measured unemployment rate is 6%
Q264: Refer to the information provided in Figure
Q272: Only when the unemployment rate is equal
Q279: Economists who argue that the AS curve
Q280: Economists who argue that the AS curve
Unlock this Answer For Free Now!
View this answer and more for free by performing one of the following actions

Scan the QR code to install the App and get 2 free unlocks

Unlock quizzes for free by uploading documents