Refer to the information provided in Figure 26.1 below to answer the question(s) that follow. 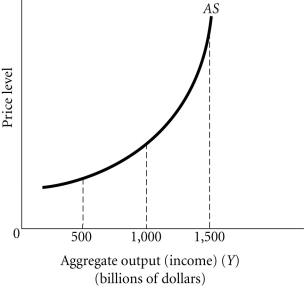 Figure 26.1
-Refer to Figure 26.1. This economy is most likely experiencing excess capacity at aggregate output levels
A) above $1,500 billion.
B) between $1,000 billion and $1,500 billion.
C) between $500 billion and $1,000 billion.
D) below $500 billion.
Correct Answer:
Verified
Q1: Refer to the information provided in Figure
Q2: The quantity of output supplied at different
Q3: Refer to the information provided in Figure
Q3: When the aggregate supply curve is vertical,
Q7: Refer to the information provided in Figure
Q10: The aggregate supply curve
A) is the sum
Q10: Refer to the information provided in Figure
Q13: If the economy is operating on the
Q16: The graph that shows the relationship between
Q20: When the aggregate supply curve is horizontal,
A)
Unlock this Answer For Free Now!
View this answer and more for free by performing one of the following actions

Scan the QR code to install the App and get 2 free unlocks

Unlock quizzes for free by uploading documents