A quality analyst wants to construct a sample mean chart for controlling a packaging process. He knows from past experience that the process standard deviation is two ounces. Each day last week, he randomly selected four packages and weighed each. The data from that activity appears below.
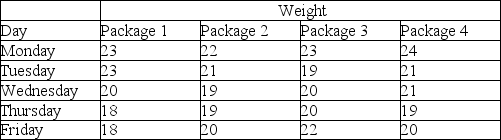 (a) Calculate all sample means and the mean of all sample means.
(b) Calculate upper and lower control limits that allow for natural variations.
(c) Is this process in control?
Correct Answer:
Verified
View Answer
Unlock this answer now
Get Access to more Verified Answers free of charge
Q101: The _ is the percent defective in
Q105: Can "in control" and "capable" be shown
Q123: Pierre's Motorized Pirogues and Mudboats is setting
Q126: Cartons of Plaster of Paris are supposed
Q130: A hospital-billing auditor has been inspecting patient
Q132: The mean and standard deviations for a
Q140: A woodworker is concerned about the quality
Q164: What is the basic objective of a
Q219: What does it mean for a process
Q248: What is acceptance sampling?
Unlock this Answer For Free Now!
View this answer and more for free by performing one of the following actions

Scan the QR code to install the App and get 2 free unlocks

Unlock quizzes for free by uploading documents