Refer to the graph below.The Keeling curve,shown here,provides us with more than a half-century of precise measurements of atmospheric CO2 concentrations over Mauna Loa,Hawaii.Do these data show a trend,and if so,what is the trend? 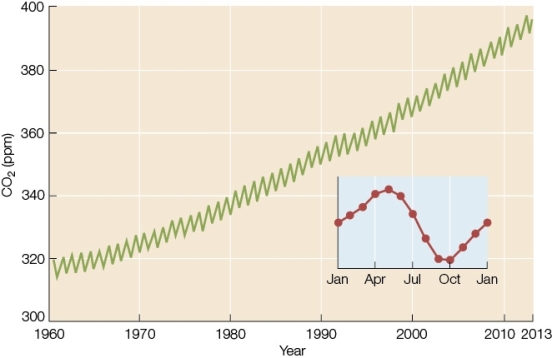
A) No;the data appear random.
B) No;the data show constant variability,not a definite trend.
C) Yes;the data show a slight,but insignificant,upward trend.
D) Yes;the data show an upward trend,but variability makes it invalid.
E) Yes;the data show a definite upward trend with predictable seasonal variations.
Correct Answer:
Verified
Q70: In general,how have patterns of precipitation around
Q71: How are warming temperatures likely to affect
Q72: Which development is not one of the
Q73: Leaves of most deciduous trees in Mediterranean
Q74: Which organism response most likely represents a
Q76: What is the relationship between global warming
Q77: If Hadley cells were to shrink rather
Q78: What is the major reason scientists think
Q79: How do scientists expect communities to change
Q80: CO2 concentrations in the Northern Hemisphere follow
Unlock this Answer For Free Now!
View this answer and more for free by performing one of the following actions

Scan the QR code to install the App and get 2 free unlocks

Unlock quizzes for free by uploading documents