Multiple Choice
 In the diagram above,D represents the original demand curve,S represents the original supply curve,and S' represents the supply curve once a per-unit tax is imposed.
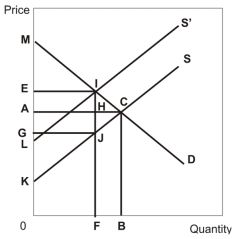
-Refer to the diagram above.The amount of tax revenue raised by this tax is equal to the area represented by the area
A) EGJCI.
B) AGJH.
C) EAHI.
D) IJC.
E) EGJI.
Correct Answer:
Verified
Related Questions

