Multiple Choice
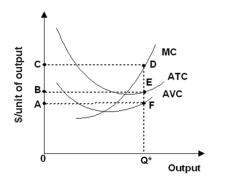
-Refer to the graph above.The line segment FE represents the
A) average variable cost at output level Q*.
B) average fixed cost at output level Q*.
C) average total cost at output level Q*.
D) the marginal cost of producing the last unit of output,when total output is equal to Q*.
E) the fixed cost of producing at output level Q*.
Correct Answer:
Verified
Related Questions

