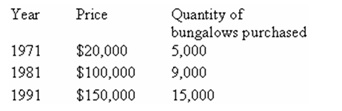
-The data show the quantity of small bungalows sold in a suburb of Toronto during the month of January.Based on the given data,we can conclude that:
A) the demand curve is not downward-sloping after all.
B) the demand curve is generally downward-sloping,but it does not apply to the housing market in Toronto.
C) there are exceptions to the generally downward-sloping demand curve;the period 1971 to 1991 is an example of such exceptions.
D) the demand curve for small bungalows around Toronto in 1971 to 1991 is upward-sloping.
E) over the 30-year period,the demand curve most likely shifted to the right.
Correct Answer:
Verified
Q140: In general,when the supply curve shifts to
Q141: Two recent studies conclude that increased fibre
Q142: Q143: Suppose that a market is currently at Q144: Q146: "As the price of personal computers continues Q147: Suppose that both the supply of beer Unlock this Answer For Free Now! View this answer and more for free by performing one of the following actions Scan the QR code to install the App and get 2 free unlocks Unlock quizzes for free by uploading documents![]()
![]()

