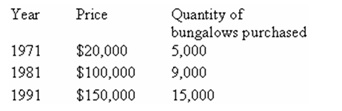
-The data show the quantity of small bungalows sold in a suburb of Toronto during the month of January.Based on the given data,we can conclude that
A) the demand curve for bungalows must have shifted to the right,but the supply curve has not shifted.
B) the supply curve for bungalows must have shifted to the right,but the demand curve has not shifted.
C) there is a movement upward along the 1971 demand curve.
D) there is a movement upward along the 1971 supply curve.
E) both the demand curve and the supply curve of 1971 have shifted to the left.
Correct Answer:
Verified
Q152: Q153: Assume both the demand for,and the supply Q154: Which of the following would be expected Q155: Q156: The essential difference between a change in Q158: Suppose that bad weather destroys the cocoa Unlock this Answer For Free Now! View this answer and more for free by performing one of the following actions Scan the QR code to install the App and get 2 free unlocks Unlock quizzes for free by uploading documents![]()
![]()

