Multiple Choice
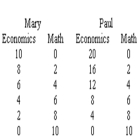
Refer to the graph below.Given Mary and Paul's production possibilities tables for answering economics and math problems,which curve represents their combined production possibilities curve if they take advantage of their comparative advantages? 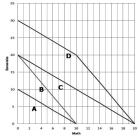
A) A
B) B
C) C
D) D
E) Not shown.
Correct Answer:
Verified
Related Questions
Q81: When individuals or groups specialize in producing

