The following graph shows annual production and consumption possibilities for North Eastwood,a country in which only grapes and bread are consumed. 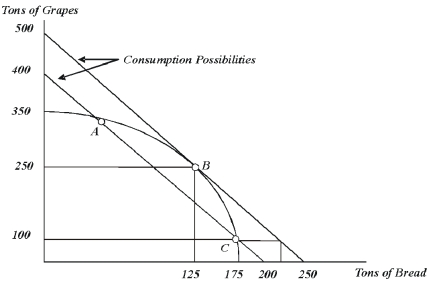
-If North Eastwood has a closed economy,the maximum amount of grapes its citizens can consume is __________ tons per year,and the maximum amount of bread its citizens can consume is __________ tons per year.
A) 250;500
B) 350;175
C) 400;200
D) 175;350
E) 500;250.
Correct Answer:
Verified
Q10: The world price is the price at
Q17: Autarky is a situation in which a
Q18: All possible combinations of goods and services
Q19: Consumption possibilities are
A) the quantity of goods
Q20: The consumption possibilities for a closed economy
Q21: The losers from trade are the _
Q24: Producers of imported goods are _ as
Q25: Consumers of imported goods are _ as
Q26: The residents of North Eastwood could increase
Q27: If the world price is less than
Unlock this Answer For Free Now!
View this answer and more for free by performing one of the following actions

Scan the QR code to install the App and get 2 free unlocks

Unlock quizzes for free by uploading documents