The following graph shows annual production and consumption possibilities for North Eastwood,a country in which only grapes and bread are consumed. 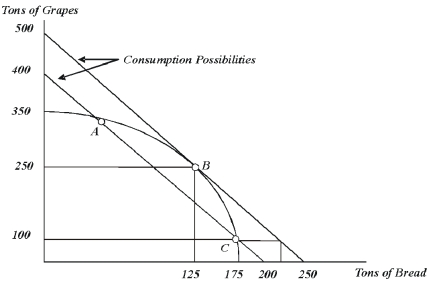
-If North Eastwood has a closed economy and is producing 125 tons of bread,its citizens will be able to consume ___________ tons of grapes.
A) 100
B) 250
C) more than 250 but fewer than 350
D) 350
E) 500
Correct Answer:
Verified
Q27: If the world price is less than
Q28: Graphically,to maximize consumption,a country produces where the
Q33: Producers of imported goods are _ as
Q34: Under free trade,countries will _ goods for
Q34: Consumers of imported goods are _ as
Q35: The consumption possibilities for a(n)_ economy are
Q36: The price at which a good or
Q36: The slope of the consumption possibilities curve
Q40: If trade is unrestricted,countries will _ goods
Q96: According to the comparative advantage model of
Unlock this Answer For Free Now!
View this answer and more for free by performing one of the following actions

Scan the QR code to install the App and get 2 free unlocks

Unlock quizzes for free by uploading documents