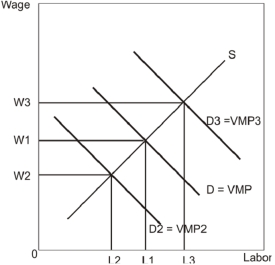
-Refer to the diagram above.The movement from labour demand curve D to D3 is a(n) __________ in labour demand,which could have been caused by a(n) __________.
A) increase;decrease in worker productivity
B) decrease;decrease in demand for the industry's output
C) increase;increase in worker productivity
D) decrease;decrease in worker productivity
E) shift;unknown factor
Correct Answer:
Verified
Q89: Firms and individuals do not technically buy
Q90: Q91: A decrease in demand for a firm's Q92: The labour force consists of those people Q93: If Mary does not have a job,she Q95: All else remaining the same,an increase in Unlock this Answer For Free Now! View this answer and more for free by performing one of the following actions Scan the QR code to install the App and get 2 free unlocks Unlock quizzes for free by uploading documents![]()

