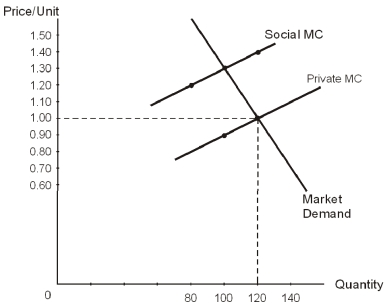
-Refer to the diagram above.The vertical distance between the private MC and the social MC represents
A) excess demand due to prices set too high.
B) excess demand due to prices set too low.
C) the per-unit external cost of production not picked up by the producing firm.
D) the per-unit external cost of production picked up by the consumers.
E) the per-unit external cost of production picked up by the government in the form of taxes.
Correct Answer:
Verified
Q35: Bob lives in a residential neighbourhood that
Q36: Bob lives in a residential neighbourhood that
Q37: Q38: Bob lives in a residential neighbourhood that Q39: The major implication of the _ is Q41: Paul owns a home on the top Q42: When the market produces output where the![]()
Unlock this Answer For Free Now!
View this answer and more for free by performing one of the following actions

Scan the QR code to install the App and get 2 free unlocks

Unlock quizzes for free by uploading documents