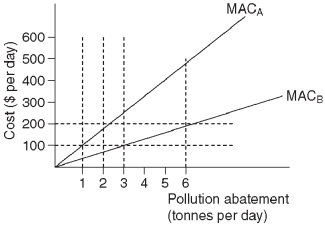
 This diagram shows the costs incurred by firm A and firm B as they reduce the pollution from their factories.MACA represents the marginal abatement cost for firm A and MACB represents the marginal abatement cost for firm B.
-Refer to the diagram above.Suppose that the government imposes a tax of $100 per tonne of pollution per day.As a result,firm A will reduce pollution by _______ tonne(s) per day and firm B will reduce pollution by _________ tonne(s) per day.
A) 1;3
B) 3;1
C) 2;6
D) 6;2
E) 3;3
Correct Answer:
Verified
Q110: The two firms listed below have five
Q111: The two firms listed below have five
Q112: Compared to an across-the-board reduction,taxing pollution emissions
Q113: The two firms listed below have five
Q114: Which of the following programs would most
Q116: Assume that large firms can reduce pollution
Q117: The two firms listed below have five
Q118: Which of the following would NOT be
Q119: The three firms below have five choices
Q120: The advantage of selling pollution permits rather
Unlock this Answer For Free Now!
View this answer and more for free by performing one of the following actions

Scan the QR code to install the App and get 2 free unlocks

Unlock quizzes for free by uploading documents