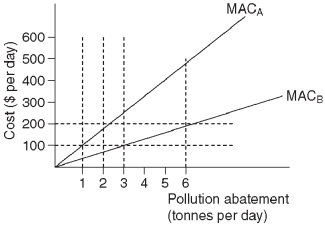
 This diagram shows the costs incurred by firm A and firm B as they reduce the pollution from their factories.MACA represents the marginal abatement cost for firm A and MACB represents the marginal abatement cost for firm B.
-Refer to the diagram above.Suppose that the government imposes a tax of $200 per tonne of pollution per day.As a result,firm A will reduce pollution by _______ tonne(s) per day and firm B will reduce pollution by _________ tonne(s) per day.
A) 1;3
B) 3;1
C) 2;6
D) 6;2
E) 3;3
Correct Answer:
Verified
Q124: The positive correlation between economic success and
Q125: Viewed from the perspective of a common
Q126: The optimal quantity of a negative externality
Q127: Dustin owns a very powerful stereo system.Dustin's
Q128: Limitations on private property rights are
A) the
Q130: A resource that has private property rights
Q131: A resource that has common property rights
Q132: Paul owns a home on the top
Q133: Paul owns a home on the top
Q134: It is always the case that
A) pollution
Unlock this Answer For Free Now!
View this answer and more for free by performing one of the following actions

Scan the QR code to install the App and get 2 free unlocks

Unlock quizzes for free by uploading documents