The following data show the relationship between the number of drivers who leave for work at 8:00 a.m. ,their average commute times,and their marginal benefit associated with the commute times. 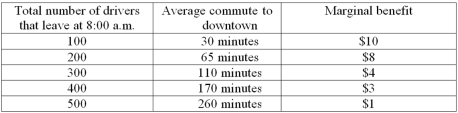
-Refer to the data above.Suppose that a toll is imposed in the following way: leaving between 8:00 a.m.and 9:00 a.m.costs $5 per driver,while after 9:00 a.m.the toll is zero.One can predict that __________ drivers will leave after 9:00 a.m.
A) 100
B) 200
C) 300
D) 400
E) 500
Correct Answer:
Verified
Q147: Suppose that four land owners,A,B,C,and D,own adjacent
Q148: Suppose that four land owners,A,B,C,and D,own adjacent
Q149: Adam and Jon are the only players
Q150: Suppose that four land owners,A,B,C,and D,own adjacent
Q151: When one person's performance is judged relative
Q153: Which of the following statements about common
Q154: The following data show the relationship between
Q155: The following data show the relationship between
Q156: The following data show the relationship between
Q157: The following data show the relationship between
Unlock this Answer For Free Now!
View this answer and more for free by performing one of the following actions

Scan the QR code to install the App and get 2 free unlocks

Unlock quizzes for free by uploading documents