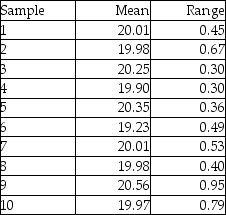
Ten samples of size four were taken from a process,and their weights measured.The sample averages and sample ranges are in the following table.Construct and plot an x-bar and R-chart using these data.Is the process in control?
Correct Answer:
Verified
View Answer
Unlock this answer now
Get Access to more Verified Answers free of charge
Q66: Cartons of Plaster of Paris are supposed
Q67: Repeated sampling of a certain process shows
Q68: McDaniel Shipyards wants to develop a control
Q70: The defect rate for a product has
Q72: A quality analyst wants to construct a
Q73: Larry's boat shop wants to monitor the
Q75: Examine the Statistical Process Control outputs below.Answer
Q79: A woodworker is concerned about the quality
Q183: Why do range charts exist? Aren't x-bar
Q186: The width of a bronze bar is
Unlock this Answer For Free Now!
View this answer and more for free by performing one of the following actions

Scan the QR code to install the App and get 2 free unlocks

Unlock quizzes for free by uploading documents