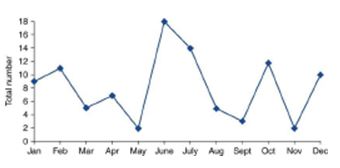
 A nurse explaining the above graph indicates the frequency of falls in 2011 to detect and possibly explain causes of variation. The peaks in June were attributed to regular staff vacations during which agency nurses were used. The nurse is employed in which role?
A) Case Manager
B) Quality Manager
C) Forensic Nurse
D) Occupational Health Nurse
Correct Answer:
Verified
Q8: A nurse working in a factory performs
Q9: A patient is admitted for a hip
Q10: People are living longer and with older
Q11: In differentiating between interprofessional and multidisciplinary:
A) multidisciplinary
Q18: A nurse tallies the patient satisfaction surveys
Q19: A nurse notices that care is often
Q21: The role of the Clinical Nurse Leader
Q22: A new role, the clinical nurse leader:
Q23: Advanced practice nurses are prepared minimally at
Q24: A nurse has critical care experience and
Unlock this Answer For Free Now!
View this answer and more for free by performing one of the following actions

Scan the QR code to install the App and get 2 free unlocks

Unlock quizzes for free by uploading documents