The table below lists the scores of eight students on a test to measure anxiety,as well as the typical number of cigarettes each person smokes daily.
Scores on the anxiety test can range anywhere from a low of 0 (indicating very low anxiety)to a high of 30 (indicating very high anxiety).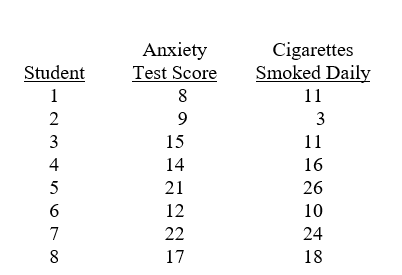
Construct a scatterplot to represent the correlation between smoking and anxiety.Describe the direction of the correlation and give two possible explanations for it.
Correct Answer:
Verified
Q47: The most frequently occurring score in a
Q50: The mean of a distribution of scores
Q57: In a group of five individuals,two report
Q299: Psychologists' personal values and goals
A) are carefully
Q321: At Michigan State University,32 students are enrolled
Q323: Potential research participants are told enough about
Q327: After an experiment,research participants are told its
Q328: Design an experiment to test whether drinking
Q330: Speaking at Verbatim University's graduation ceremony,Professor Robson
Q333: The ethics codes of the American Psychological
Unlock this Answer For Free Now!
View this answer and more for free by performing one of the following actions

Scan the QR code to install the App and get 2 free unlocks

Unlock quizzes for free by uploading documents