The following table shows the number of U.S. dollars required to buy one Mexican peso and the number of U.S. dollars required to buy one Japanese yen between June 1, 2016, and September 1, 2016. Use this table to answer the following questions. 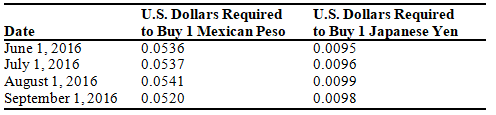
-Between June 1,2016,and July 1,2016,the number of U.S.goods exported to Mexico likely
A) increased because U.S.goods became more expensive to consumers in Mexico.
B) decreased because U.S.goods became more expensive to consumers in Mexico.
C) increased because U.S.goods became less expensive to consumers in Mexico.
D) decreased because U.S.goods became less expensive to consumers in Mexico.
E) did not change because exchange rates do not affect trade.
Correct Answer:
Verified
Q30: If interest rates rise in the United
Q31: The following table shows the number of
Q32: The following table shows the number of
Q33: If interest rates fall in the United
Q34: The following table shows the number of
Q36: The following table shows the number of
Q37: When demand for Canada's exports falls,
A) Canadian
Q38: If interest rates in Canada increase relative
Q39: When demand for Canada's exports rises,
A) demand
Q40: The following table shows the number of
Unlock this Answer For Free Now!
View this answer and more for free by performing one of the following actions

Scan the QR code to install the App and get 2 free unlocks

Unlock quizzes for free by uploading documents