The arrows in Figures A–D represent possible movements of the exchange rate (euros per U.S. dollar) and the quantity of U.S. dollars buyers are willing and able to buy. Use these figures to answer the following questions. 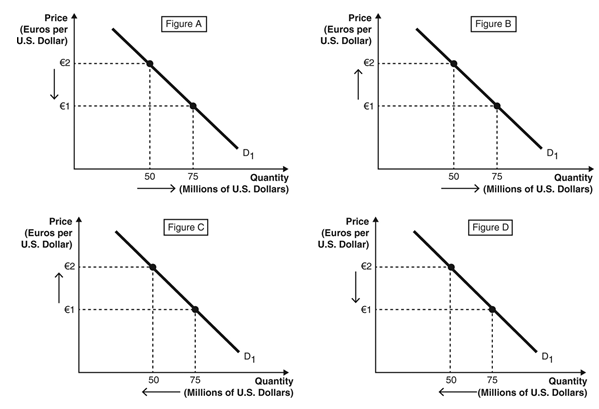
-An appreciation of the euro against the U.S.dollar is represented by Figure ________,and a depreciation of the U.S.dollar against the euro is represented by Figure ________.
A) A; C
B) A; A
C) B; D
D) D; B
E) A; D
Correct Answer:
Verified
Q55: The following two figures depict the demand
Q56: If interest rates in Australia decrease relative
Q57: The following two figures depict the demand
Q58: The following figure depicts the demand for
Q59: _ occurs when a national government or
Q61: Which of the following goods/services is considered
Q62: The following two graphs depict the equilibrium
Q63: If the assumptions for the theory of
Q64: Pegged exchange rates can also be referred
Q65: Suppose market forces outside of the control
Unlock this Answer For Free Now!
View this answer and more for free by performing one of the following actions

Scan the QR code to install the App and get 2 free unlocks

Unlock quizzes for free by uploading documents