Use the following graph to answer the following questions.The graph depicts an economy where aggregate demand and long-run aggregate supply (LRAS) have decreased,with no change in short-run aggregate supply (SRAS) .
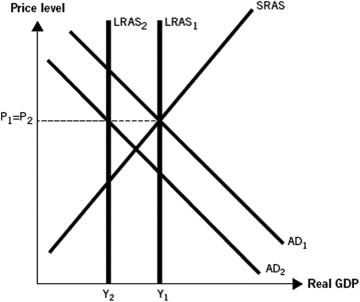
-The graph accurately summarizes what happened during the Great Recession,because during that time,the price level ________ and real gross domestic product (GDP) ________.
A) decreased; decreased
B) increased; increased
C) remained largely unchanged; decreased
D) decreased; remained unchanged
E) remained unchanged; increased
Correct Answer:
Verified
Q6: Use the following graph to answer the
Q7: The Great Recession lasted for _ months.
A)
Q8: The Great Recession lasted from _ to
Q9: The Great Recession was similar to most
Q10: Which of the following best summarizes the
Q12: The Great Recession ended in
A) June 2009.
B)
Q13: During the Great Recession,a major financial crisis
Q14: During the Great Recession,there was a financial
Q15: The Great Recession was different from other
Q16: The Great Recession began in
A) December 2009.
B)
Unlock this Answer For Free Now!
View this answer and more for free by performing one of the following actions

Scan the QR code to install the App and get 2 free unlocks

Unlock quizzes for free by uploading documents