Use the following graph to answer the following questions.The graph depicts an economy where aggregate demand and long-run aggregate supply (LRAS) have decreased,with no change in short-run aggregate supply (SRAS) .
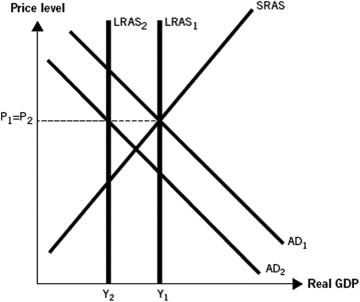
-During the Great Recession,real gross domestic product (GDP) decreased,yet the aggregate price level remained largely unchanged,as depicted in the graph.Unemployment increased to above-normal levels.Which of following best explains why this happened?
A) A significant decline in military spending following the end of a war led to a recession.
B) A sharp recession followed the United States abandoning the gold standard.
C) A decline in housing prices and stock prices,plus a financial crisis,caused a recession.
D) A sudden increase in oil prices caused inflation and a deep recession.
E) A stock market crash,large numbers of bank failures,an increase in tax rates,and a tight money supply caused a recession.
Correct Answer:
Verified
Q29: Use the following graph to answer the
Q30: During the Great Recession,the U.S.long-run aggregate supply
Q31: A decline in U.S.wealth would tend to
Q32: Use the following graph to answer the
Q33: The Great Recession is characterized by a
Q35: When U.S.aggregate demand and long-run aggregate supply
Q36: During the Great Recession,the U.S.aggregate demand curve
Q37: During the Great Recession,_ caused long-run aggregate
Q38: During the Great Recession,aggregate demand _ and
Q39: An institutional breakdown in U.S.financial markets would
Unlock this Answer For Free Now!
View this answer and more for free by performing one of the following actions

Scan the QR code to install the App and get 2 free unlocks

Unlock quizzes for free by uploading documents