Refer to the following graph to answer the following questions: 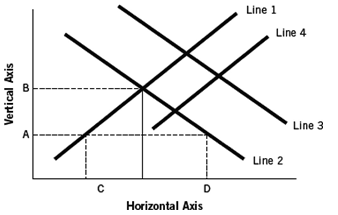
-Assuming the figure represents the market for loanable funds,which of the following would represent a decrease in time preferences (i.e.,people are more patient) ?
A) a shift from line 1 to line 4
B) a shift from line 4 to line 1
C) a shift from line 2 to line 3
D) movement from A to B
E) a new shortage of loanable funds represented by the distance from C to D
Correct Answer:
Verified
Q61: Refer to the following graph to answer
Q62: Assume deflation is occurring in a nation;
Q63: Which combination of events could have caused
Q64: Which combination of events could have caused
Q65: If foreign entities save more and businesses
Q67: If foreign entities save less and governments
Q68: Wealth increases in the United States because
Q69: By 1981
A) interest rates were about 5
Q70: Refer to the following graph to answer
Q71: Inflation reached its peak (of at least
Unlock this Answer For Free Now!
View this answer and more for free by performing one of the following actions

Scan the QR code to install the App and get 2 free unlocks

Unlock quizzes for free by uploading documents