Refer to the following graph that describes income and consumption patterns over a typical life cycle to answer the following questions: 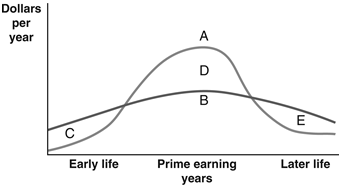
-Which part of the accompanying graph depicts borrowing?
A) curve A
B) curve B
C) region C
D) region D
E) region E
Correct Answer:
Verified
Q122: Why does the demand curve for loanable
Q123: Personal savings as a percentage of disposable
Q124: In the last decade,the U.S.savings rate has
A)
Q125: Those who believe that the overall decline
Q126: Which of the following reflects an accurate
Q128: It is likely that as more baby
Q129: Which is a correct version of the
Q130: The savings rate is
A) the difference between
Q131: The notion of compound interest means that
A)
Q132: Every _ requires a _.
A) savings dollar;
Unlock this Answer For Free Now!
View this answer and more for free by performing one of the following actions

Scan the QR code to install the App and get 2 free unlocks

Unlock quizzes for free by uploading documents