Refer to the following graph that describes income and consumption patterns over a typical life cycle to answer the following questions: 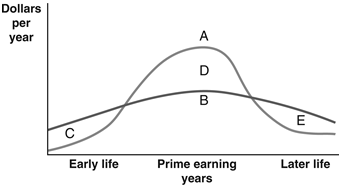
-Which part of the accompanying graph depicts saving?
A) curve A
B) curve B
C) region C
D) region D
E) region E
Correct Answer:
Verified
Q141: What would happen if foreigners no longer
Q142: Explain why the market for loanable funds
Q143: Which event could be expected to shift
Q144: Why or how might it be said
Q145: What is the effect of a decrease
Q147: List the factors of demand for loanable
Q148: List the factors of supply for loanable
Q149: Which factor may be expected to exert
Q150: What would be an example of increased
Q151: What does it mean if we say
Unlock this Answer For Free Now!
View this answer and more for free by performing one of the following actions

Scan the QR code to install the App and get 2 free unlocks

Unlock quizzes for free by uploading documents