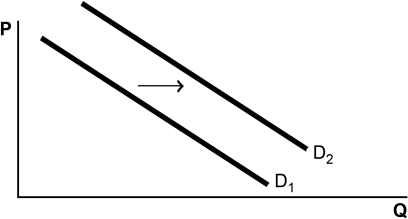
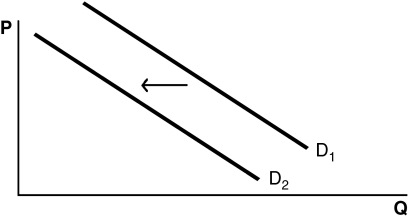
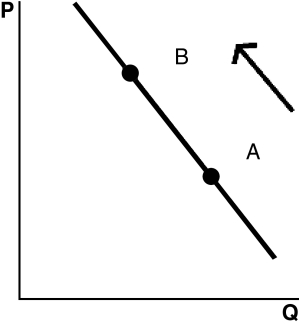
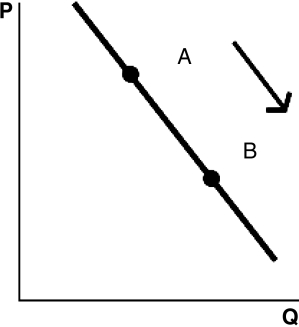
Refer to the following graphs to answer the following questions:
A.
 B.
B.
 C.
C.
 D.
D.
 E.
E.
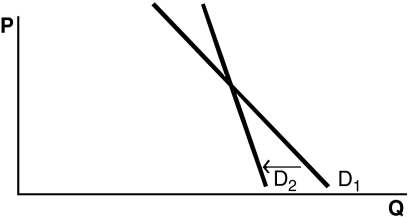
-Choose the graph that represents the following situation: Out of fear of losing their jobs in a depressed economic climate,workers increase their rate of production.
A) Graph A
B) Graph B
C) Graph C
D) Graph D
E) Graph E
Correct Answer:
Verified
Q29: Refer to the following graphs to answer
Q30: Refer to the following graphs to answer
Q31: Use the following graph,which depicts Mighty Max's
Q32: Bobby knows that she is producing a
Q33: As computer usage in companies and in
Q35: The substitution effect describes the
A) incentive to
Q36: Use the following graph,which depicts Mighty Max's
Q37: If more of the production process for
Q38: Use the following graph,which depicts Mighty Max's
Q39: The backward-bending labor supply curve occurs because
Unlock this Answer For Free Now!
View this answer and more for free by performing one of the following actions

Scan the QR code to install the App and get 2 free unlocks

Unlock quizzes for free by uploading documents