The following figure depicts the downward-sloping market demand (D) curve for a five-day western Caribbean cruise on Carnival Cruise Lines.The price (P) is per person in U.S.dollars,and the quantity (Q) is the number of passenger tickets sold.This figure also shows the company's relevant marginal revenue (MR) curve and marginal cost (MC) curve.Use this figure to answer the following questions:
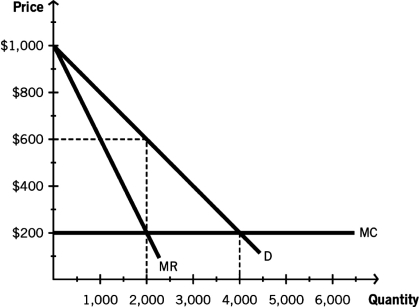
-If this cruise line is a monopoly that charges a single price of $600 per passenger,what is the amount of consumer surplus?
A) $400,000
B) $600,000
C) $800,000
D) $1.2 million
E) $1.6 million
Correct Answer:
Verified
Q76: The following figure depicts a generalized downward-sloping
Q77: Consider the following scenario to answer the
Q78: The following figure depicts a generalized downward-sloping
Q79: Suppose the market for golf clubs has
Q80: The reason economists use the term "perfect"
Q82: In the movie Legally Blonde,a sales associate
Q83: An outlet mall tends to be more
Q84: use the table to answer the follwoing
Q85: use the table to answer the follwoing
Q86: The following figure depicts a generalized downward-sloping
Unlock this Answer For Free Now!
View this answer and more for free by performing one of the following actions

Scan the QR code to install the App and get 2 free unlocks

Unlock quizzes for free by uploading documents