Consider the actual and forecast values contained in the table. 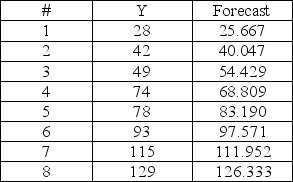 At which observation is the tracking signal at its maximum value?
A) Observation #5
B) Observation #7
C) Observation #4
D) Observation #6
Correct Answer:
Verified
Q75: Consider the actual and forecast values contained
Q76: If the Q1 demand for a particular
Q77: Consider the actual and forecast values contained
Q78: A seasonal index of _ indicates that
Q79: Consider the actual and forecast values contained
Q81: Use simple exponential smoothing with α =
Q82: Plossl and Wight suggest a reasonable limit
Q83: One MAD is equivalent to approximately
A)0.8.
B)1.2.
C)1.6.
D)2.0.
Q84: The following table represents the new members
Q85: Daily humidity in the city of Houston
Unlock this Answer For Free Now!
View this answer and more for free by performing one of the following actions

Scan the QR code to install the App and get 2 free unlocks

Unlock quizzes for free by uploading documents