Demand for Y is shown in the table. 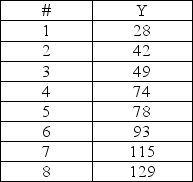 Develop a forecast using a trend line.What is the forecast for period 12?
A) 181.7
B) 183.9
C) 185.1
D) 187.3
Correct Answer:
Verified
Q89: The following table represents the new members
Q90: Demand for a particular type of battery
Q91: Plossl and Wight suggest a reasonable limit
Q92: The tracking signal is the running sum
Q93: Demand for Y is shown in the
Q95: The following table shows the number of
Q96: Daily humidity in the city of Houston
Q97: Use simple exponential smoothing with α =
Q98: Daily humidity in the city of Houston
Q99: Daily high temperatures in the city of
Unlock this Answer For Free Now!
View this answer and more for free by performing one of the following actions

Scan the QR code to install the App and get 2 free unlocks

Unlock quizzes for free by uploading documents