The following table shows the number of pies consumed by the deans' suite during a monthly pie-eating contest. 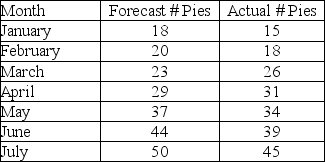 What is the forecast bias?
A) -1.86
B) -1.04
C) 1.04
D) 1.86
Correct Answer:
Verified
Q83: One MAD is equivalent to approximately
A)0.8.
B)1.2.
C)1.6.
D)2.0.
Q84: The following table represents the new members
Q85: Daily humidity in the city of Houston
Q86: The following table shows the number of
Q87: Tim gave his new intern the task
Q89: The following table represents the new members
Q90: Demand for a particular type of battery
Q91: Plossl and Wight suggest a reasonable limit
Q92: The tracking signal is the running sum
Q93: Demand for Y is shown in the
Unlock this Answer For Free Now!
View this answer and more for free by performing one of the following actions

Scan the QR code to install the App and get 2 free unlocks

Unlock quizzes for free by uploading documents