Table 15-1
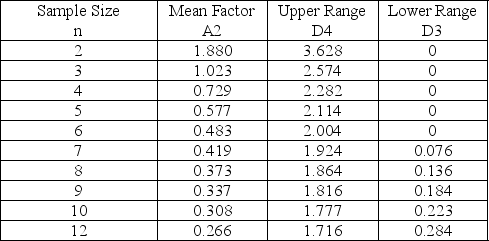
-Refer to Table 15-1.To guarantee that cans of soup are properly filled, some cans are sampled and the amounts measured.The overall average for the samples is 12 ounces.Each sample contains 10 cans.The average range is 0.4 ounces.The upper control chart limit for the sample averages would be
A) 12.1232.
B) 11.8768.
C) 13.2.
D) 12.308.
Correct Answer:
Verified
Q32: R-charts measure changes in
A)central tendency.
B)degree of variation.
C)number
Q33: The Q34: Variations that need not occur in production Q35: The inspection of cans of juice involves Q36: The R-chart would be useful when we Q38: Who introduced control charts in 1924? Q39: The central limit theorem states that the Q40: A run of four consecutive points above Q41: Which of the following control charts is/are Q42: Defects in computer hard-drives will usually render![]()
A)took
A)W.Edwards Deming
B)Philip
Unlock this Answer For Free Now!
View this answer and more for free by performing one of the following actions

Scan the QR code to install the App and get 2 free unlocks

Unlock quizzes for free by uploading documents