Table 15-1
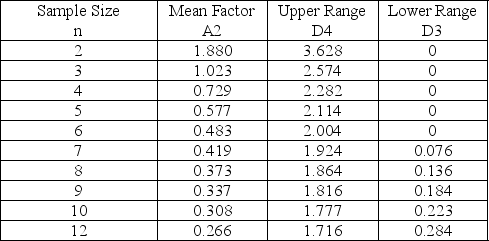
-Refer to Table 15-1.To guarantee that cans of soda are properly filled, some cans are sampled and the amounts measured.The overall average for the samples is 12 ounces.Each sample contains 10 cans.The average range is 0.4 ounces.The lower control chart limit for the sample averages would be
A) 12.1232.
B) 11.8768.
C) 13.2.
D) 12.308.
Correct Answer:
Verified
Q43: The p-chart would be useful when we
A)took
Q44: Which of the following statements is false
Q45: A quality control program is being developed
Q46: A p-chart is based on which of
Q47: Which of the following control charts is/are
Q49: Table 15-1 Q50: A c-chart is based on which of Q51: The U.S.government award for quality achievement is Q52: Table 15-1 Q53: Table 15-1 Unlock this Answer For Free Now! View this answer and more for free by performing one of the following actions Scan the QR code to install the App and get 2 free unlocks Unlock quizzes for free by uploading documents
![]()
![]()
![]()

